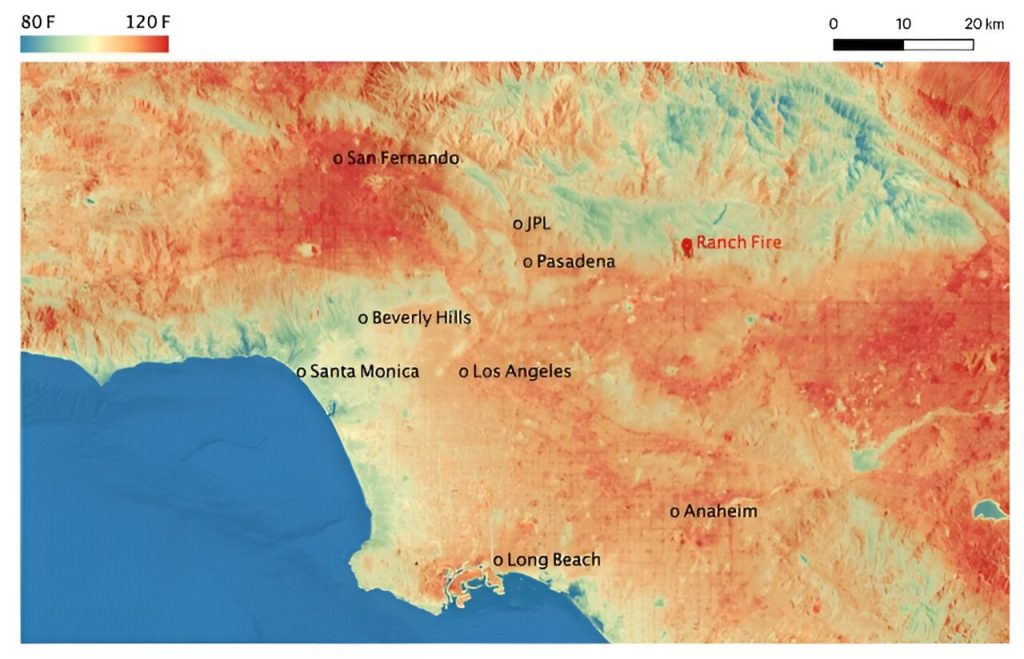
Made using NASA’s ECOSTRESS instrument, this map shows land-surface temperatures, or how hot the land is to the touch, in much of L.A. County on Aug. 14, 2020. Peak land-surface temperature in the San Fernando Valley hit 128.3 degrees Fahrenheit (53.5 degrees Celsius), while coastal areas stayed cooler. Credit: NASA/JPL-Caltech
No stranger to hot weather, the Southern California region is facing more humid heat waves that test the adaptability of its residents. But different areas feel different effects.
Like much of the planet, the region is expected to experience more heat waves in the future due to Earth’s changing climate. And some of these will feel increasingly humid, as long-term forecasts call for muggy spells more typically associated with Florida or eastern Texas.
To begin to understand what these changes could mean across the greater Los Angeles area, scientists at NASA’s Jet Propulsion Laboratory in Southern California mapped how extreme heat and humidity patterns vary with regional geography. The results underscore how air temperature alone does not tell the full story of dangerous heat.
The findings are published in the Journal of Applied Meteorology and Climatology.
“We can’t just look at air temperature when we talk about heat wave impacts,” said study author Anamika Shreevastava, a NASA postdoctoral program fellow at JPL. “People tend to get acclimatized to where they live. We have to understand how anomalous conditions are making a difference in what people are used to.”
Climate change is fueling longer, hotter, and more frequent heat waves. In the U.S., extreme heat is the No. 1 weather-related killer, causing more deaths than hurricanes and floods, according to the National Weather Service.
Greater Los Angeles is a prime example of an urban heat island—cities and suburbs woven with heat-trapping concrete and asphalt that lead to warmer temperatures than nearby rural areas that have more vegetation. Bordered by mountains and the ocean, the Greater L.A. area encompasses suburbs and skyscrapers, with a dense population and disparities in green space. It includes several counties, tens of thousands of square miles, and more than 18 million people, making it a compelling test bed for heat wave research.
Climate change and urban heat are together fueling different heat waves now. In the 20th century, most heat waves in L.A. were dry. However, humid events have steadily increased in frequency and intensity since 1950 due in part to swelling moisture from the warming sea surface.
In their case study, JPL scientists compared two heat waves that affected the Greater Los Angeles area in the summer of 2020: a prolonged muggy stretch in August and an extremely dry three-day spike in September. During the latter event, record-breaking temperatures soared over 120 degrees Fahrenheit (49 degrees Celsius) in the San Fernando Valley—a densely populated portion of the city of Los Angeles—while scorching winds fanned a destructive wildfire in the nearby San Gabriel Mountains.
For their study, the scientists used NASA’s Modern-Era Retrospective Analysis for Research and Applications, version 2 (MERRA-2) data set—a reanalysis of historical atmospheric observations. They found that both heat waves drove temperatures above the 90th percentile for the August-September climate record in L.A. Using advanced weather modeling, they simulated the heat waves and looked at their impacts across the region.
The researchers found that although air temperatures were as much as 18 degrees Fahrenheit (10 degrees Celsius) cooler during the muggy August heat wave, the heat stress to human health was more intense than the September event. That’s because the wet-bulb temperature—which relates heat to how well our bodies cool down by sweating—surged due to the humidity.
The results underscore the importance of including humid heat when issuing extreme heat warnings, the scientists said.
Local impacts
Another key finding of the study was that heat waves don’t touch every place the same way. “The same heat wave can feel different because of local climate variabilities and disparities in vegetation, which has a shading and cooling effect. These small-scale variabilities make a big difference in impact,” said Shreevastava, who studies extreme heat and its effect on urban and natural ecosystems.
Shreevastava and her team examined three regions that experienced the 2020 heat waves differently: Southern L.A. County and Orange County stayed cooler, given their proximity to the Pacific Ocean and coastal moisture. Valley regions, including San Fernando and Riverside, skewed drier and hotter. Central L.A. fell between the two extremes.
Despite the microclimate variations, humidity had a leveling effect: Both the coastal and inland areas experienced increased nighttime heat stress during the muggy August heat wave. This was a notable change for the valley regions, which historically have countered scorching daytime temperatures with drier nights. Valley areas such as those in San Bernardino and Riverside counties experienced the greatest change over recent historical averages, with up to 10.8 degrees Fahrenheit (6 degrees Celsius) of added heat stress during humid heat wave nights.
The researchers said that their findings highlight how disparities in small-scale heat wave patterns across urban neighborhoods are vitally important when designing emergency plans and policies for our shared, hotter future.
More information: Anamika Shreevastava et al, Contrasting Intraurban Signatures of Humid and Dry Heatwaves over Southern California, Journal of Applied Meteorology and Climatology (2023). DOI: 10.1175/JAMC-D-22-0149.1
Citation: NASA maps key heat wave differences in Southern California (2023, August 22) retrieved 5 September 2023 from https://phys.org/news/2023-08-nasa-key-differences-southern-california.html
This document is subject to copyright. Apart from any fair dealing for the purpose of private study or research, no part may be reproduced without the written permission. The content is provided for information purposes only.

